Jewelry Meta Ads: More Sales and Cheaper New Customers on the Same Budget


I took over a US DTC jewelry brand’s Meta account in July. Over July 9–September 5, total sales reached $890,689, up 19.98% versus the dashboard’s previous period. That works out to roughly $148K more in total sales. All-channel ad spend fell 2.58%.
Effectively the same budget. More sales. And the account was putting new-customer acquisition first.
Blended ROAS increased from approximately 2.13 to 2.57. Meta ROAS increased from approximately 1.67 to 2.20. New-customer CPA fell 22.42%, to $108. This is a current, active client, and they’re very happy with the performance. The brand stays anonymous; the numbers are below.
The full jewelry case study gives you the visual walkthrough. Here, I want to explain the decisions behind it. Because “we optimized the account” tells you absolutely nothing.
First, the actual numbers
The comparison covers roughly two months of my management, July 9–September 5, 2026. The business spent $356,366 across channels, or approximately $178K per month across that window. Meta accounted for $304,277 of that spend. Keep those two budgets separate.
| Metric | Previous, approximately | Current | Change |
|---|---|---|---|
| Total sales | $742,365 | $890,689 | +19.98% |
| All-channel ad spend | $365,804 | $356,366 | −2.58% |
| Blended ROAS | 2.13 | 2.57 | +20.66% |
| New-customer CPA | $139.21 | $108.00 | −22.42% |
| New-customer ROAS | 0.83 | 1.16 | +39.76% |
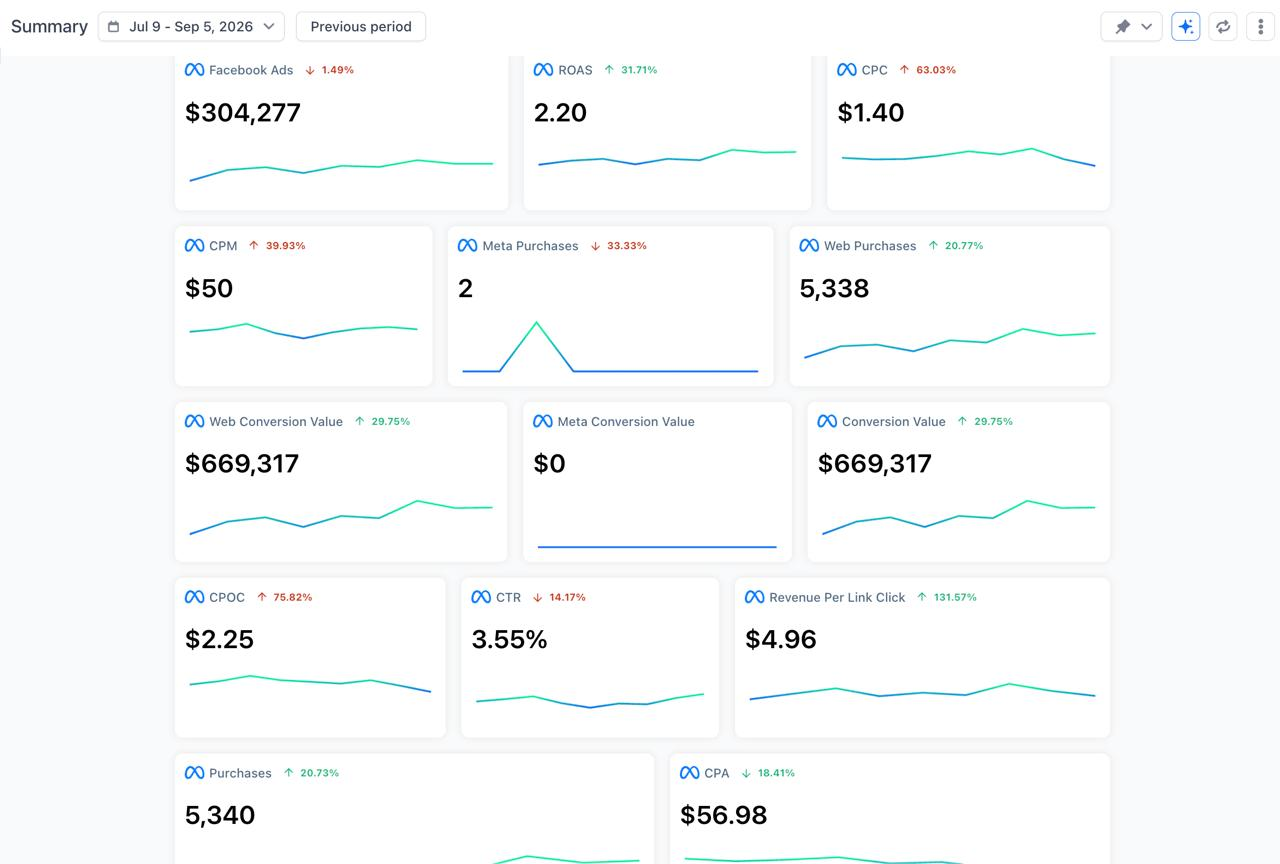
| Meta ROAS | 1.67 | 2.20 | +31.71% |
The previous values are back-calculated from the current values and the displayed percentage changes. For total sales: $890,689 ÷ 1.1998 ≈ $742,365. Subtract that from $890,689 and you get approximately $148,324 in additional total sales. The screenshot’s percentages are rounded, so the reconstructed values are approximate too.
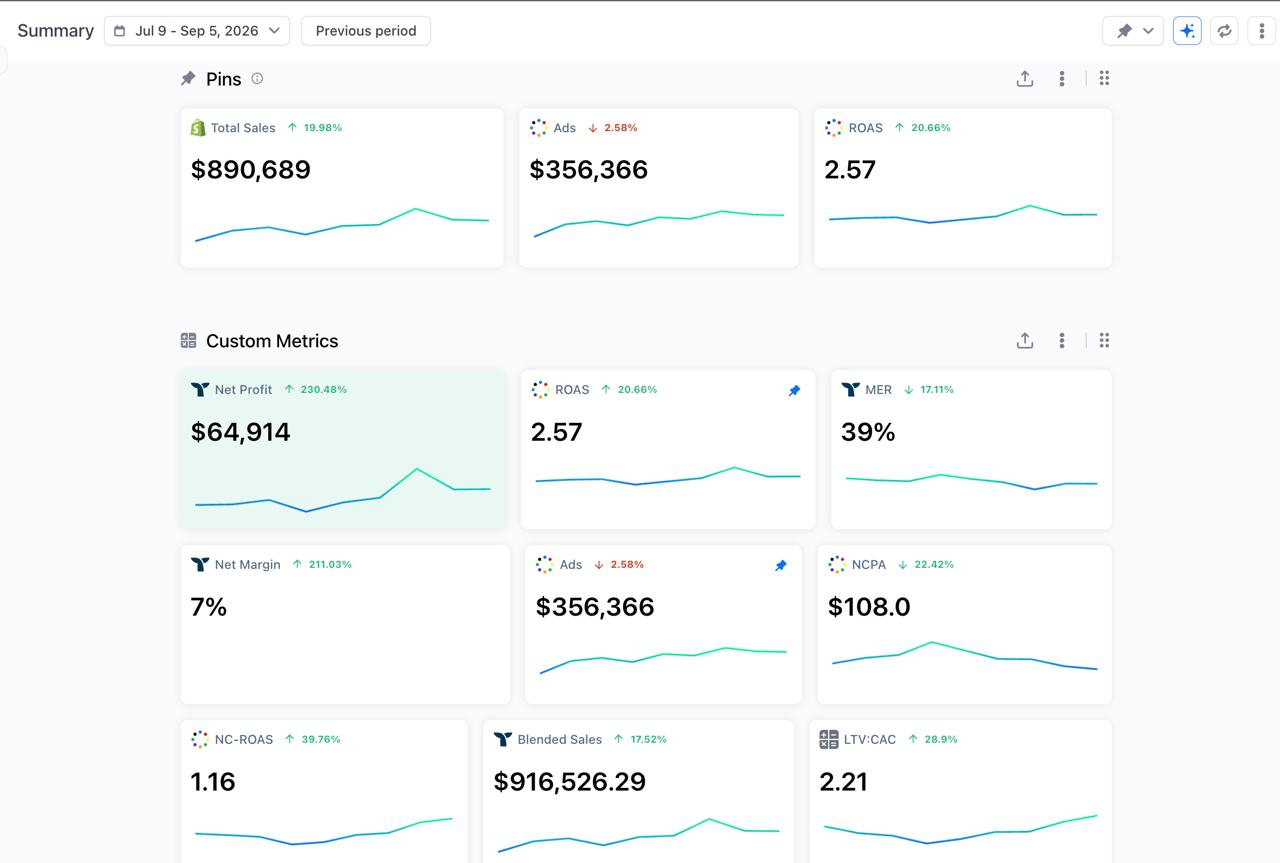
The dashboard reports blended ROAS separately from total sales. Its blended-sales value is $916,526.29; total sales are $890,689. I’m using total sales for the ~$148K revenue lift and the displayed ROAS for the efficiency comparison. Mixing those definitions would give you a different number.
Metric definitions: ROAS means return on ad spend. NCPA is new-customer cost per acquisition. NC-ROAS is the dashboard’s return on ad spend for new customers. The monthly export’s purchase CPA includes its reported purchases and is a different measure from NCPA.
I made new customers the priority
The account needed to work harder at acquisition. I directed spend toward new customers and kept new-customer CPA and new-customer ROAS in the conversation alongside the blended return.
That changes how you judge the work. You need to ask what it costs to bring someone new into the business, then check whether overall efficiency is holding. A single headline ROAS number cannot answer both questions.
Here, the two moved together: NCPA went from approximately $139 to $108, while new-customer ROAS increased 39.76% to 1.16. Blended ROAS also improved by 20.66%. The screenshots don’t include a new-customer count, so I’m reporting the acquisition efficiency measures they actually show.
I simplified the account. CBO only.
I fixed the account structure and used only CBO campaigns: budget allocation at campaign level. I wanted a setup I could manage clearly, with the spend and the winning creative working together.
Consolidation was ongoing. As recent winners emerged, I kept bringing them together in the account. A creative that has just proved itself needs a clear place in the structure; otherwise, the account becomes a collection of tests with no coherent next move.
For this engagement, CBO and consolidation were part of the operating approach I chose. The screenshots show the combined outcome of the work. They don’t isolate the effect of CBO from creative, bidding, or the acquisition shift.
I tested different cost caps with high budgets
I introduced my advanced cost-cap scaling strategy: test different caps with high campaign budgets, watch actual delivery, and evaluate the acquisition result.
The distinction matters. A high campaign budget gives a setup room to spend. The actual spend is what appears on the bill. In this case, I used that room while total spend across the comparison window stayed slightly below the previous period.
I wasn’t treating one cap as a magic number. Testing different caps was part of finding a workable balance between delivery and efficiency for this account. The reported result came from managing that process alongside creative and structure, not from setting a cap and walking away.
I cover the broader approach in my cost-cap scaling guide. This jewelry account is a concrete example of how I used it within a wider acquisition strategy.
Fresh creative. Consolidated winners. Less panic.
I ensured new creatives kept launching and directed the team on strategy. That gave us a continuing stream of ideas to test and recent winners to consolidate. Creative launches and account management had to stay connected.
The less glamorous part was pushing back. When changes became too fast or too reactive, I said so. Constantly changing the plan makes it harder to understand what the last decision actually did.
That doesn’t mean ignoring performance. It means making a decision, watching the relevant result, and being deliberate about the next change. Sometimes the useful move is a new test. Sometimes it’s consolidating a winner. Sometimes it’s leaving the setup alone long enough to read it.
My job includes telling the team when to move, and when another change would just add noise.
This is the operating sequence I used:
- Set the acquisition priority: direct spend toward new customers.
- Build around CBO and cost caps: simplify the structure and test delivery at different caps.
- Keep creative moving: launch new ads and consolidate recent winners.
- Make deliberate decisions: direct the team and push back on reactive changes.
Meta ROAS rose 31.71% on slightly lower spend
For July 9–September 5, Meta spend was $304,277, down 1.49%. Meta ROAS reached 2.20, up 31.71% from an implied baseline of approximately 1.67. Meta-reported purchase conversion value reached $669,317, up 29.75%.
That is the channel result. It sits alongside the business-level sales and acquisition metrics above. I don’t add Meta conversion value to total sales; those are different views of performance.
Month by month: 1.92 → 2.30 → 2.47 ROAS
The monthly Ads Manager export shows the progression clearly. July website ROAS was 1.92. August was 2.30. September 1–5 reached 2.47. Purchase CPA moved from $64.24 to $54.59 to $51.59.
| Period | Spend | Purchases | Purchase CPA | Website ROAS |
|---|---|---|---|---|
| July 1–31 | $132,214.28 | 2,058 | $64.24 | 1.92 |
| August 1–31 | $168,963.65 | 3,095 | $54.59 | 2.30 |
| September 1–5, partial | $32,757.25 | 635 | $51.59 | 2.47 |

September is an early reading, not a completed month. July includes July 1–8, before the July 9 start of the main comparison window. This export therefore covers different dates from the dashboards, and its totals should not be combined with theirs. Purchase CPA here also differs from the new-customer CPA measure above.
What this result actually tells you
Over my first roughly two months managing the account, the business recorded about $148K more total sales while spending slightly less on ads. Blended ROAS improved. Meta ROAS improved. New-customer acquisition got cheaper.
That’s a strong result. It’s also a before-and-after account comparison, not a controlled incrementality test. The two dashboards show “Previous period,” without exposing its exact dates. My management approach and the client’s satisfaction are my account of the engagement; all three screenshots are included unchanged so you can inspect the reported numbers yourself.
If you’re running a DTC brand and want this level of attention on your account, see my ecommerce Meta ads management. I handle the structure, the creative direction, and the decisions about where the money goes.
Want the same? Schedule the call. You’ll talk directly with me.